In Michael Nemeth’s 2009 book Cinderella’s Slipper, the author used forensic statistical analysis to determine which statistics most commonly lead to wins in football. After analyzing the results of tens of thousands of games, Nemeth simplified it down to one thing: teams who are able to take the ball from their side of the field and convert it into points win the most. Using Nemeth’s theory, I’ve come up with a simply model of offensive and defensive efficiency to grade A&M following games. This offensive and defensive efficiency model can be applied to all teams in all conferences at all levels of football.
Offensive And Defensive Efficiency Explained
At its heart, Nemeth’s findings make sense. The goal of football is to outscore the opponent. Every score or stop on downs results in a kickoff or punt. Kickoffs and punts normally result in a field position on the offense’s side of the field. The ability to consistently move the ball from your side to the opponents side and score points is efficiency. The measure of how consistently you move the ball and convert it into points is offensive efficiency. How well you stop the opponent from moving the ball and converting possession into points is defensive efficiency.
When grading offensive efficiency and defensive efficiency, you take all of the possessions in a game, and discard any that start on the opponents side of the field or end at halftime or end of the game. All possessions which start on your side of the 50 yard line are valid. Any possession beginning in the opponent’s territory is invalid. All scores resulting from possession advancing into opponent’s territory are valid. A field goal and a touchdown count equally as valid scores. An interception return for a score or a fumble returned for a score do not count as valid scores.
Likewise, a turnover resulting in possession beginning on your side of the field does not count against the defense. The defense is not penalized for preventing a score on a short field because they are not responsible for that field position. Similarly, the offense is not rewarded for scoring on a short field.
Average And Stellar Efficiency Numbers
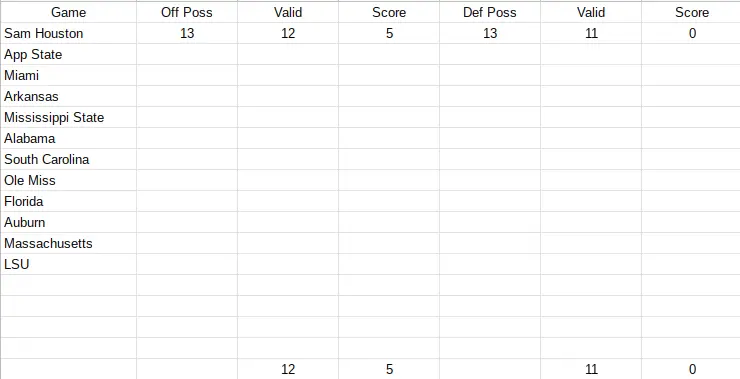
Teams average right around 12-14 offensive possessions during a game. During A&M’s 31-0 win over Sam Houston, both teams had 13 possessions. Both teams had two turnovers in the game (two interceptions for A&M, an interception and fumble for Sam Houston) which explain the extra possessions. An average offense will convert somewhere around 35-40% of their possessions into points. A stellar offense is anything over 40%, and anything over 50% means you’re basically an unstoppable machine. When you’re converting over one of every two possessions into points, you’re rolling on offense.
Likewise, an average defense allows scores somewhere around 33-40% of the time, under 30% is stellar, and anything under 20% is excellent. Your top defenses in the nation usually rank somewhere between 15-25% in defensive efficiency.

As we can see from the graph above, both the Aggies and Bearkats had 13 possessions, with A&M’s final possession ending the second half. The Aggies had 12 valid possessions, the Bearks had 11. A&M converted 5 of their 12 possessions into points, so an offensive efficiency of 41.67%. This puts A&M just above average and bordering on stellar.
Sam Houston had 11 valid possessions and converted none of them into points in the shutout. 0% defensive efficiency is obviously the top score a defense can achieve in a game.
As the season moves along, we’ll try to track offensive and defensive efficiency for A&M for every game.

